Example
- This example demonstrates the implementation of a 16-QAM communication system.
The code follows the block diagram below:

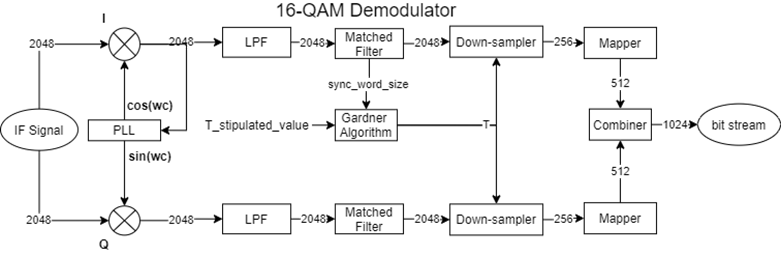
import source.modulation
import source.demodulation
import source.channel
import source as qf
import matplotlib.pyplot as plt
import numpy as np
import scipy.fftpack as sf

plt.close('all')

def QAMsys(SNR, plot = 1):
   """16QAM system.

   Args:
      SNR (float): Signal to Noise Ratio (dB)
      plot (int, optional): If it's set to 1 the graphics will be plotted, if it's set to 0 there will be no plots. Default: 1.

      output (float): Bit error rate (BER).
   """
   # Upsampler Factor
   K = 10

   # Number of symbols
   Ns = 256

   # Roll-off factor
   alpha = 0.3

   # Bits per symbol
   Bs = 4

   # 16QAM Constellation vector
   QAM16 = [-1, -0.333, 0.333, 1]

   # Intermediary frequency
   Fif = 2e6

   # Sampling Rate
   Fs = Fif * K / 2

   # Pseudo-Rand Generator with synchronization bits
   data = qf.modulation.data_gen(Ns * Bs)

   # Slicer
   (dataI, dataQ) = qf.modulation.slicer(data)

   # Mapper
   mapI = qf.modulation.mapper_16QAM(QAM16, dataI)
   mapQ = qf.modulation.mapper_16QAM(QAM16, dataQ)

   # Up-sampler
   upI = qf.modulation.upsampler(Ns, K, mapI)
   upQ = qf.modulation.upsampler(Ns, K, mapQ)

   # Shaping filter
   [shape_I, a, b] = qf.modulation.shaping_filter(upI, Ns, alpha, Fif, Fs)
   [shape_Q, a, b] = qf.modulation.shaping_filter(upQ, Ns, alpha, Fif, Fs)

   template = b

   # Oscillator
   delta_phase = np.random.normal(0, np.pi / 3, 1)
   delta_freq = np.random.normal(0, 20, 1)

   (loCos_TX, t) = qf.modulation.oscillator(0, 4e-4, 2 /
                                 (Fif * K),  Fif + delta_freq, delta_phase + np.pi / 2)
   (loSin_TX, t) = qf.modulation.oscillator(0, 4e-4, 2 /
                                 (Fif * K),  Fif + delta_freq, delta_phase)

   # Mixers
   mixI = qf.modulation.mixer(shape_I, loCos_TX)
   mixQ = qf.modulation.mixer(shape_Q, loSin_TX)

   # Combiner
   IF = qf.modulation.combiner(mixI, mixQ)

   # Noise
   IF_n = qf.channel.AWGN(IF, SNR, K)

   # Synchronization
   loCos_RX, loSin_RX = qf.demodulation.PLL(IF_n, Fs, len(loCos_TX), K // 2)

   # Mixer
   shape_I_demod = qf.modulation.mixer(IF_n, loCos_RX)
   shape_Q_demod = qf.modulation.mixer(IF_n, loSin_RX)

   # Low Pass Filter (Butterworth)
   fc = 1e6
   [shape_I_demod_filt, W, h] = qf.demodulation.LPF(shape_I_demod, fc, Fs)
   [shape_Q_demod_filt, W, h] = qf.demodulation.LPF(shape_Q_demod, fc, Fs)

   # Matched Filter
   signal_I = qf.demodulation.matched_filter(shape_I_demod_filt, template)
   signal_Q = qf.demodulation.matched_filter(shape_Q_demod_filt, template)

   # Sampling - Gardner Algorithm
   symbols_I = qf.demodulation.downsampler(signal_I, len(data), K)
   symbols_Q = qf.demodulation.downsampler(signal_Q, len(data), K)

   if plot == 1:
      plt.figure(0)
      plt.stem(data)
      plt.title('Data')
      plt.grid()

      plt.figure(1)
      plt.subplot(2, 1, 1)
      plt.stem(mapI)
      plt.title('Mapper I')
      plt.grid()
      plt.subplot(2, 1, 2)
      plt.stem(mapQ)
      plt.title('Mapper Q')
      plt.tight_layout()
      plt.grid()

      plt.figure(2)
      plt.scatter(mapI, mapQ)
      plt.title('Constellation IQ out mapper')
      plt.xlabel('In-Phase')
      plt.ylabel('Quadrature')
      plt.tight_layout()
      plt.grid()

      plt.figure(3)
      plt.subplot(2, 1, 1)
      plt.stem(upI)
      plt.grid()
      plt.title('Up-Sampler I')
      plt.subplot(2, 1, 2)
      plt.stem(upQ)
      plt.title('Up-Sampler Q')
      plt.tight_layout()
      plt.grid()

      plt.figure(4)
      plt.plot(a, b)
      plt.title('SRRC Filter Impulse Response')
      plt.grid()
      plt.figure(5)
      plt.subplot(3, 1, 1)
      plt.plot(shape_I)
      plt.title('Raised Cosine Filter Convolution I')
      plt.grid()
      plt.subplot(3, 1, 2)
      plt.plot(shape_Q)
      plt.title('Raised Cosine Filter Convolution Q')
      plt.grid()
      plt.subplot(3, 1, 3)
      plt.plot(shape_I, shape_Q)
      plt.title('Constallation IQ filter output')
      plt.tight_layout()
      plt.grid()

      X_f = abs(sf.fft(upI))
      l = np.size(upI)
      fr = (Fs / 2) * np.linspace(0, 1, l // 2)
      xl_m = (2 / l) * abs(X_f[0 : np.size(fr)])

      plt.figure(6)
      plt.subplot(2, 1, 1)
      plt.plot(fr / 1e6, 20 * np.log10(xl_m))
      plt.title('Upsampler Output Spectrum')
      plt.xlabel('Frequency(MHz)')
      plt.ylabel('Magnitute(dB)')
      plt.grid()
      plt.tight_layout()

      X_f2 = abs(sf.fft(shape_I))
      l2 = np.size(shape_I)
      fr2 = (Fs / 2) * np.linspace(0, 1, l2 // 2)
      xl_m2 = (2 / l2) * abs(X_f2[0 : np.size(fr2)])

      plt.subplot(2, 1, 2)
      plt.plot(fr2 / 1e6, 20 * np.log10(xl_m2))
      plt.title('Shaping Filter Output Spectrum')
      plt.xlabel('Frequency(MHz)')
      plt.ylabel('Magnitute(dB)')
      plt.grid()
      plt.tight_layout()

      X_f_1 = abs(sf.fft(loCos_TX))
      l_1 = np.size(loCos_TX)
      fr_1 = (Fs / 2) * np.linspace(0, 1, l_1 // 2)
      xl_m_1 = (2 / l_1) * abs(X_f_1[0 : np.size(fr_1)])

      plt.figure(7)
      plt.subplot(2, 1, 1)
      plt.plot(fr_1 / 1e6, 20 * np.log10(xl_m_1))
      plt.title('Spectrum of local oscillator')
      plt.xlabel('Frequency(MHz)')
      plt.ylabel('Magnitute(dB)')
      plt.grid()

      plt.subplot(2, 1, 2)
      plt.plot(t, loCos_TX)
      plt.title('Local Cos')
      plt.xlabel('t(s)')
      plt.ylabel('Amplitude')
      plt.tight_layout()
      plt.grid()

      plt.figure(8)
      plt.subplot(3, 1, 1)
      plt.plot(mixI)
      plt.title('Mix I')
      plt.ylabel('Amplitude')
      plt.tight_layout()
      plt.grid()

      plt.subplot(3, 1, 2)
      plt.plot(mixQ)
      plt.title('Mix Q')
      plt.ylabel('Amplitude')
      plt.tight_layout()
      plt.grid()

      plt.subplot(3, 1, 3)
      plt.plot(IF_n)
      plt.title('Mix IQ')
      plt.ylabel('Amplitude')
      plt.tight_layout()
      plt.grid()

      X_f1 = abs(sf.fft(IF_n))
      l1 = np.size(IF_n)
      fr1 = (Fs / 2) * np.linspace(0, 1, l1 // 2)
      xl_m1 = (2 / l1) * abs(X_f1[0 : np.size(fr1)])

      plt.figure(9)
      plt.plot(fr1 / 1e6, 20 * np.log10(xl_m1))
      plt.title('IF Spectrum')
      plt.xlabel('Frequency (MHz)')
      plt.ylabel('Magnitute (dB)')
      plt.tight_layout()
      plt.grid()

      plt.figure(10)
      plt.plot(IF_n)
      plt.title('Mixed Signal')
      plt.xlabel('Samples')
      plt.ylabel('Amplitude')

      plt.figure(11)
      plt.subplot(2, 1, 1)
      plt.plot(loCos_RX)
      plt.plot(loCos_TX)
      plt.title("TX and RX Cos")
      plt.subplot(2, 1, 2)
      plt.plot(loSin_RX)
      plt.plot(loSin_TX)
      plt.title("TX and RX Sin")

      plt.figure(12)
      plt.subplot(2, 1, 1)
      plt.plot(shape_I_demod)
      plt.title('Demodulator Mix I')
      plt.ylabel('Amplitude')
      plt.tight_layout()
      plt.grid()

      plt.subplot(2, 1, 2)
      plt.plot(shape_Q_demod)
      plt.title('Demodulator Mix Q')
      plt.ylabel('Amplitude')
      plt.tight_layout()
      plt.grid()

      X_f3 = abs(sf.fft(shape_I_demod))
      l3 = np.size(shape_I_demod)
      fr3 = (Fs / 2) * np.linspace(0, 1, l3 // 2)
      xl_m3 = (2 / l3) * abs(X_f3[0 : np.size(fr3)])

      plt.figure(13)
      plt.plot(fr3 / 1e6, 20 * np.log10(xl_m3))
      plt.title('Demodulator Mixer Output')
      plt.xlabel('Frequency (MHz)')
      plt.ylabel('Magnitute (dB)')
      plt.grid()

      plt.figure(14)
      plt.subplot(3, 1, 1)
      plt.plot(W, 20 * np.log10(h))
      plt.title('Filter Freq. Response')
      plt.xlabel('Frequency(Hz)')
      plt.ylabel('Magnitute(dB)')
      plt.grid()

      plt.subplot(3, 1, 2)
      plt.plot(shape_I_demod_filt)
      plt.title('Filtered Signal I')
      plt.tight_layout()
      plt.ylabel('Amplitude')
      plt.grid()

      plt.subplot(3, 1, 3)
      plt.plot(shape_Q_demod_filt)
      plt.title('Filtered Signal Q')
      plt.tight_layout()
      plt.ylabel('Amplitude')
      plt.grid()

      plt.figure(15)
      plt.subplot(3, 1, 1)
      plt.plot(a,template)
      plt.title('Template for Matched filter')
      plt.tight_layout()
      plt.grid()

      plt.subplot(3, 1, 2)
      plt.plot(signal_I)
      plt.title('Signal I')
      plt.tight_layout()
      plt.grid()

      plt.subplot(3, 1, 3)
      plt.plot(signal_Q)
      plt.title('Signal Q')
      plt.tight_layout()
      plt.grid()

      plt.figure(16)
      plt.subplot(2, 1, 1)
      plt.stem(symbols_I)
      plt.title('Demodulated Symbols I')
      plt.grid()
      plt.subplot(2, 1, 2)
      plt.stem(symbols_Q)
      plt.title('Demodulated Symbols Q')
      plt.grid()
      plt.tight_layout()

      plt.figure(17)
      plt.scatter(mapI, mapQ)
      plt.title('Constellation TX')
      plt.grid()
      plt.figure(18)
      plt.scatter(symbols_I, symbols_Q)
      plt.title('Constellation RX')
      plt.grid()
      plt.tight_layout()

      plt.show()

   # Demapper
   data_demod = qf.demodulation.demapper(symbols_I, symbols_Q, len(data))

   # Computing Error
   error = np.count_nonzero(data_demod != data)
   BER = (error * 100) / len(data)

   print("\n\n\n")
   print("BER:", BER, "%")
   print("Phase Offset Through AWGN Channel:", delta_phase / np.pi, "pi rad")
   print("Frequency Offset AWGN Channel:", delta_freq, "Hz")
   print("\n\n\n")

   return BER / 100